Useful Java Debugging Tips with Eclipse
In this tutorial we will see about
debugging java applications using Eclipse. Debugging helps us to identify and
fix defects in the application. We will focus on run-time issues and not
compile time errors. There are command line debuggers like gdb available. In
this tutorial we will focus on GUI based debugger and we take our favorite IDE
Eclipse to run through the tutorial. Though we say Eclipse, the points are
mostly generic and is suitable for debugging using most of the IDEs like
NetBeans too.
Do not use System.out.println as
a tool to debug.
- Enable
detailed log level of all the components involved.
- Use a log
analyzer to read logs.
1. Conditional Breakpoint
Hope we know how to add a breakpoint. If
not, just click on the left pane (just before the line number) and a breakpoint
will be created. In debug perspective, ‘Breakpoints’ view will list the
breakpoint created. We can add a boolean condition to it. That is, the
breakpoint will be activated and execution will hold only if the boolean
condition is met otherwise this breakpoint will be skipped.

2. Exception Breakpoint
In Breakpoints view there is a button
labeled as J! We can use that button
to add a java exception based breakpoint. For example we want the program to
halt and allow to debug when a NullPointerException is
thrown we can add a breakpoint using this.

3. Watch Point
When a chosen attribute is accessed or
modified program execution will halt and allow to debug. Select a class
variable in Outline view and from its context menu select Toggle Watchpoint.
This will create a watch point for that attribute and it will be listed in
Breakpoints view.

4. Evaluation (Display or Inspect or Watch)
Ctrl+Shift+d or Ctrl+Shift+i on a selected variable or
expression will show the value. We can also add a permanent watch on an
expression/variable which will be shown in Expressions view when debug is on.

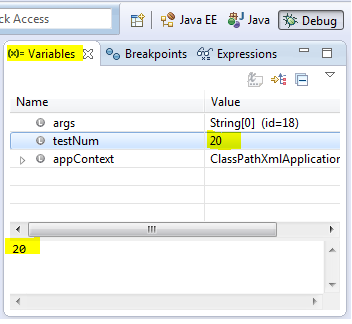
5. Change Variable Values
We can change the value of a variable on
the fly during debug. Choose a variable and go to Variables view and select the
value, type and enter.
6. Stop in Main
In Run/Debug Settings, Edit Configuration
we can enable a check box that says Stop in main. If enabled when we debug a
java program that launches with a main method, the execution halts at first
line of main method.

7. Environment Variables
Instead of going to System properties to
add an environment variable, we can conveniently add it through Edit
Configuration dialog box.

8. Drop to Frame
This is the second best feature I love. We
can just return the control to any frame in the call stack during debug.
Changes made to variables will not be reset. Choose the stack level which you
want to go back and restart debug from there and click the drop to frame button
from debug toolbar. Eclipse is cool!

9. Step Filter
When we Step Into (F5) a method we may go
into external libraries (like java) and we may not need it. We can add a filter
in preferences and exclude packages.

10. Step Into, Over and Return
I kept this as the last point as this is
the first thing to learn in debugging :-)
- F5 – Step
Into: moves to next step and if the current line has a method call the
control will go into the first line of the called method.
- F6 – Step
Over: moves the control to next line. If there is a method call in the
current line, it executes the method call internally and just moves the
control to next line.
- F7 – Step
Return: When done from inside a method the control will move to the
calling line from where the current method is invoked.
- F8 – Move to next breakpoint.
